The impedance and loss of PCB are very important for the transmission of high speed signal. In order to analyze the complex transmission channel, we can study the influence of the signal by the transmission channel impulse response.
The shock response of the circuit can be obtained by transmitting a narrow pulse. The ideal narrow pulse should be an infinitely narrow, very high amplitude of a narrow pulse, when the narrow pulse propagation along the transmission line, the pulse will be broadened, and the shape of the line after the stretch response. Mathematically speaking, we can get the impulse response of the channel and the input signal to get the waveform of the signal after the channel transmission. Impulse response can also be obtained through the step response of the channel, and the differential of the step response is the impulse response, so the two are equivalent.
We seem to find the method to solve the problem, however, in the real situation, ideal narrow pulse or infinitely sharp order step signal is not exist, is not only difficult to produce and the precision is not very good control, so in the actual test more is using sine wave were measured in response to frequency domain is obtained, and the corresponding physical layer test system software to obtain the time domain response. Compared to other signals, the sine wave is more easily generated, and its frequency and amplitude accuracy are more easily controlled. Of can in up to a few tens of GHz frequency range to sweep through the sine wave of frequency and accurate measurement of transmission channels of different frequency reflection and transmission characteristics of the, the dynamic range of more than 100dB vector network analyzer VNA (vector networkanalyzer), so modern in high-speed transmission through analysis mainly will with a vector network analyzer to measure.
The reflection and transmission characteristics of the measured system can be expressed by the S parameter (S-parameter), and the S parameter describes the transmission and reflection characteristics of the measured parts for different frequencies of the sine wave. If we can get transmission channel for the reflection and transmission characteristics of the different frequency sine wave, the theory we can predict the real digital signal after this transmission channel, because the real digital signal in the frequency domain to see can be considered to be composed of many different frequencies sine wave of.
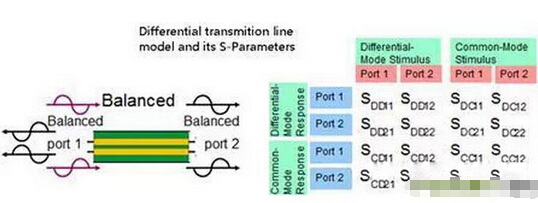
For a single end of the transmission line, it contains 4 S parameters: S11, S22, S21, S12. S11 and S22 are reflected in the ports 1 and 2 for the reflection characteristics of different frequency sine wave, S21 reflect is from one port to port 2 different frequency sine wave transmission characteristics and reflect S12 is from port to port 1 of different frequency sine wave transmission characteristics. For differential transmission lines, due to a total of 4 ports, so the S parameters are more complex, a total of 16. In general, a vector network analyzer with 4 ports and even more ports is used to measure the differential transmission lines to obtain the S parameters.
If you get a poor junction 16 S parameters measured, which on poor junction of many important characteristics has been, for example SDD21 parameters reflect poor branching insertion loss characteristics, SDD11 parameters reflect the characteristics of the return loss.
We can further get more information through the anti FFT transformation of these S parameters. For example, the SDD11 parameter transform to get the time domain reflection waveform (DomainReflection TDR:Time), through the time domain reflection waveform can reflect the measured transmission line impedance changes. We can also SDD21 on the transmission line the inverse FFT transform to obtain the impulse response, and predicting the different data rate digital signals through the poor junction after the waveform or eye. This is a very useful information for digital design engineers.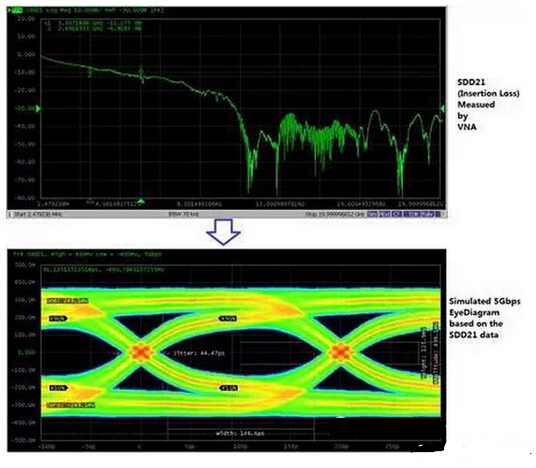
Thus, the use of vector network analyzer (VNA) of the digital signal transmission channel were measured, on the one hand from the microwave and radio frequency analysis method, can be very precise transmission channel characteristics in a few tens of GHz frequency range; on the other, through the measurement results of some simple time-domain transform, we can analyze the impedance change of channel, the influence on signal transmission to help the number of engineers in the early stage can judge the quality of the backplane, cables, connectors, PCB, without having to wait until the last signal to rush to deal with.